Little Trendyz is a small upstart that sells specialty
pajamas for newborns that have a unique closure system. As every parent knows
you spend a lot of time changing diapers during the first year your child’s
life. Most baby pajamas come with either a zipper of tiny snapping buttons that
run the length or a part of the pajamas. The issue with these designs is that
they require the pajamas to be opened all the way or are hard to close using
the small buttons. The other issue with the popular closure systems is that
they always cause discomfort for the child, complicate the diaper changing
process, and take additional time.
Little Trendyz only current product is the Zippyz, footed
pajamas for newborns that feature both buttons and a zipper. The buttons run
from the neck of the child to the lower portion of the belly. A zipper runs
from the lower portion of the belly to the foot of the baby. When a baby needs
to be changed the zipper can be undone to change the baby while the buttons can
remain closed to keep the baby warm and reduce the hassle. This allows for
easier diaper changes and reduces the time each change takes.
The pajamas are available in various sizes for newborns up
to a year old and come in various colors and style. The buyer can choose both
the size and the style, and each pair of pajamas costs 24.99$. This makes the
pajamas cost slightly more than a typical pair at a store. Currently the
pajamas can only be bought directly from the website but retailers can contact
the company for wholesale inquiries.
Zippyz Pajamas in Blue Stripe for Boys
SWOT Analysis
Internal
Strengths
-The design of Zippyz is unique which allows it to gain
a competitive edge and garner a premium price as opposed to regular footed
pajamas.
-The product is made of a natural cotton and bamboo
blend making them soft and comfortable for the child. The natural fabrics often
appeal to parents.
-The pajamas are offered in multiple colors and styles
which allows parents to choose the look that they like.
-The pajamas come with sleeves for the newborns hands, a
great addition for any baby, especially those that tend to scratch themselves
in their sleep.
Weaknesses
-Little Trendyz offers only a single product, the
pajamas. The sole source of the income is a single product whose sales can make
or break the company. This can create fluctuations in cash flows as well as
make it vulnerable to competition.
-There are currently six different styles which may be
enough for some but many parents can find it lacking in options.
-The product is made in India which may be an issue for
some and extends delivery and production times.
-Different social media platforms have various degrees
of content posted.
External
Opportunities
-The product has wide and varied audience that it can be
marketed to. All parents always look for products that make their job easier,
especially diaper changing. This product solves an issues that many parents
complain about. It is also a great gift that someone can give to new or
expecting parents.
-The product was featured by Giuliana Rancic and
selected as a Huggies MomInspired product giving early exposure to the product.
-The design is simple and could be mass manufactured if
there was a need or an opportunity.
Threats
-There are other products that aim to solve the same
problem. There are pajamas that utilized magnets, reversible zippers, and
pajamas that can also open only the bottom part.
-A larger company can easily duplicate the product with
changes to avoid patent infringement and market it at a considerably reduced price
due to economies of scale.
The last assignment of my Introduction to Integrated
Communications class is all about analytics. The assignment uses a real life
data from a health-oriented company called ABC in the assignment. After 11
weeks of trying to keep up it is my time to shine just a bit, hopefully. If I
have not mentioned already I have a penchant for all things analytics,
analysis, and even numbers. My passion for numbers and their correlation to
real life have often brought about a few sighs and snores. However it is my
belief that the rapid growth of available data is giving us a deeper insight
into the wants and needs of consumers. Now that I got my 2 cents in about how important
data and analytics I can move on to the actual analysis.
Overall Synopsis
-Over the last week ABC:
oGrew the number of Fans but the growth was below
the average growth of a typical business page
oThere was a dip in People Talking About this but
it was similar to the trend shown in Facebook Insights for prior weeks and it
not currently a cause for concern
oThe weekly total reach grew by 40%
oAlmost all of last week’s posts were text based
oText based posts do not outperform or
underperform link based posts
oThe demographic split is 60% female/ 40% male
o25-34 is the largest age segment with 18-44
accounting for the majority of people reached
oWhile fans talking about the page has been
trending down the viral reach has continually grown
oThe email newsletter has an average 25.4% open
rate and a good 10.9 click rate.
Facebook Insights Overview
Findings
Unfortunately the data set provided only included the top
level metrics from Facebook Insights and not the full page and post level
exports. Some of the findings are general level correlations that do not
necessarily identify causation. Additional knowledge of the business and
Insights exports would support or refute some of the findings.
Findings for Facebook
1.There is an inconsistency in the number of posts
each day. At times there is one or two and others four or five. By reducing the
number of posts and standardizing how many are posted each day the company
could reduce the number of hours of man hours required to create them and post
only the best content.
2.There is a discrepancy in how viral a post is to
the number of Engaged and Talking about this users. The reach greatly differs
even when there is a similar number of users engaged. This can be in part due
the number friends each fan has. On average each fan of the page has 387
friends, above the Facebook average. However there is a tendency for some users
to have over a 1000 friends thus skewing the average. When one of these mega
users engages with a post they may drastically influence Reach and account for
the variance in the metrics.
3.Commenting on the demographic breakdown is
complicated without knowing more details about the exact type of health
products the business is involved with. The 10% dominance of female’s fans on
the page is nothing out of the ordinary but might present an opportunity to
reach of to the male demographic.
4.Although not specified in the assignment I can
guess that the business is in Orlando given where from most of the people are
reached. Celebration, Kissimme, and Davenport are all towns relatively close to
Orlando and are some of the top most locations from which users visit the page.
This is great since most of the people reached are in the vicinity of the
business. It is a common misconception that a wide reach is great as this is
not true for a local business. If the business does not sell their products
online reaching someone in New York and Japan is worthless.
5.There is a dedicated core of fans that visits
the page more than 6 times. Considering that most of the growth for the page is
Viral it likely that this core set of followers is responsible for the viral
growth.
6.The number of page views jump around quite a bit
and don’t exactly correlate to the number of posts per day. This may show that
posting more posts per day does not generate more views.
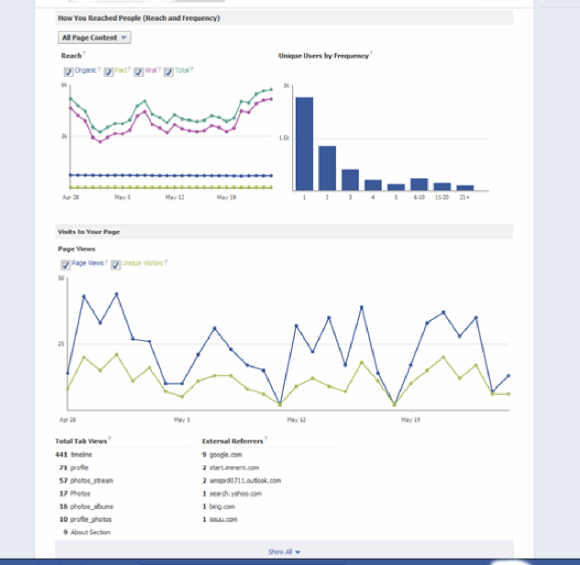
Reach Tab
Findings for Email
Newsletter
1.The number of people on the email list is over
triple the number of fans. If someone gave up their email they will likely also
follow the Facebook page.
2.The open rate is about 5-10% below average for
the health and fitness industry but has a great open rate of 10%. The open rate
could be improved by varying the title of the email and running A/B tests to
identify keywords and topics that increase open rates.
3.There are no conversions from the clicks. It is
unknown whether this is because of there is nothing to actually convert on or
no one decided to buy anything.
4.There was a small percentage of undeliverable emails
which should be scrubbed from the list.
Email newsletter metrics
Suggested
Improvements
The assignment information mentions that the business also
runs a Twitter, Pinterest, and a YouTube account. However none of the channels
appear on the external referrer’s link list. If the other channels also have
several hundred followers they should be utilized to drive traffic to each
other, including the Facebook page. The posts on each of the profiles should
integrate posts from each of the other platforms to further this traffic in
between platforms.
The Facebook page should focus on increasing its reach and
followers through organic means instead of a few people sharing their posts.
Although a high Virality is great it will follow if fans engage with the page,
it is a tic for tac mechanism. This could be achieved through advertising,
promotions, and giveaways. By holding Facebook specific promotions more people
would be encouraged to visit and follow the page.
The email newsletter could promote the Facebook and other
social media platforms. There are a few external refers from the emails to the
Facebook page showing that the email has the social links but does not actively
drive the users to the page. Highlighting the platform specific promotions
would encourage additional growth in followers.
This week the assignment for my Introduction to Multimedia Communication was to respond to a pair of reviews left for two different hotels. Below are my responses as well as the original comments. How do you think I did?
Dear Travelwith3kiddos,
We are so glad that both your stays out our hotel were enjoyable.
Although we have changed our name to Hyatt Regency Orland, we still retain the
high level of service that you have come to enjoy. The Cappricio also has
changed names to Fiorenzo Steakhouse but still has all the delicious food that
you and your family enjoyed, even Ralph is still with us.
We apologize for the minor issue with some of the debris
left over by one of the Florida storms. We always strive to maintain our
premises and clean the pool as quickly as possible after the little Florida
storms that are so common down here. Thank you for notifying us that this was
an issue during your stay as we will try even harder now to clean our pool as
quickly as possible.
v/r
Janis
Media Manager, Hyatt Regency Orlando
LUV2TRAVELWITHHUBBY,
On the behalf of the Hilton Fort Lauderdale Marina I would
like to apologize for the issues during your stay. We regret that the
unfortunate experience may have had an effect on your high school reunion as it
is supposed to be a time to meet old friends and maybe some not so friends.
Since your stay we have changed management and are working
hard to improve the quality of service we provide. Based off your review and
that of others we have upgraded our amenities, changed the way our house
service works, as well as added some other perks. We hope that the next time
you come to Fort Lauderdale you do not stay in a tent on a beach but instead
come visit us for an comfortable stay and enjoy the new amenities as well as
other upgrades. Because of the inconvenience cause during your last stay please
contact me so we can provide you with a discount as well some other perks to
make it up to you.
This week in class was all about events, event planning, and
how IMC plays into all things event. By event I mean conventions, trade shows
and such similar events. One of the examples and case studies was the
International Spa Association’s annual conference in sin city itself Las Vegas.
The expo lasted three days from October 21st to October 23rd.
Am I an expert in event planning? Absolutely not, not even
close. However this expo and the week’s material is a great opportunity to
learn about such events. So to learn more about events, share some of thoughts,
and hopefully earn a good grade we will analyze the online presence of the ISPA
2013 Las Vegas Conference and Expo. For added excitement I will brake down the
ISPA social media activity into The Good, The Bad, and The Ugly.
Overview
The ISPA created a website specifically just for the
conference that linked to all the ISPA social media platforms. There were no
unique accounts just for the expo, instead all expo related posts were
integrated with the regular ISPA posts on their regular pages. The ISPA has a
blog, Facebook page, Pinterest, Twitter, Instagram, LinkedIn, and a YouTube
channel.
The Good
The webpage is great. It is simple to navigate, provides all
the info about the conference, and links back to the ISPA page. After analyzing
with a code checker the website seemed to be well built with very few
validation errors and opened on mobile as well as different web browsers. The
only possible issue was that the social media links were placed at the bottom
of the page out of sight when the page first opens. This is not quiet bad
enough to merit to be in the Bad section, it is simply a design choice, a
choice I don’t agree with. If you are trying to drive up conversation on social
media then it should be displayed prominently.
ISPA 2013 Expo Webpage
The show was promoted prior to it kicking off on almost all
of the ISPA platforms. The Facebook and Twitter pages were filled with info and
promotions for the ISPA 2013 conference. ISPA also promoted a lot of the
companies which were scheduled to attend the event as well as their products.
On Twitter ISPA heavily Tweeted and interacted with all the companies that were
to attend. Every single day there were a dozen tweets about different deals,
promotions, and highlighting different booths. ISPA also used a number of
hashtags, especially #ISPA2013 specifically for the event. They also used
hashtags identify certain companies and their products.
ISPA Twitter
Facebook was updated daily, even multiple times a day,
before, during and after the event. Just as on Twitter they not only promoted
the event but all the different companies that were to attend. Unlike many
other ISPA also utilized hashtags on Facebook. Although hashtags are only ever
so slowly becoming popular on Facebook it can never hurt. Overall Twitter and
Facebook were well executed before, during, and after the conference.
Pinterest and Instagram both had numerous images from the
expo. They were posted by both the ISPA and the attending companies. The companies
themselves were encouraged to post images to Instagram and Pinterest with the
hash tag ISPA2013 so they would be syndicated on the ISPA profiles.
The Bad
Although I liked many of the posts on Facebook there were
simply too many. The Facebook profile was simply flooded with posts, especially
during the actual event. I understand the enthusiasm but I would get incredibly
annoyed if my feed was filled from top to bottom with just one entities posts.
I understand that this would not happen due to Edge Rank. I am not sure about
the exact inner workings of Edge Rank but from my understanding over posting is
penalized and this was definitely over posting.
The LinkedIn page no visible mention about the event apart
form a short blurb at the beginning in the Summary section. I am not connected
to the ISPA but was hoping for a bit more. The initial name makes no mention of
the expo, there are no graphics from it, or any links.
ISPA LinkedIn
The Ugly
YouTube. I would give a longer description but it is hard to
describe the complete lack of anything. The expo presents a great opportunity
for both the ISPA and the companies to create videos about anything spa
related. Tips on how to relax at home, how to pick a spa, what’s the latest in
facial treatments, anything would have worked. Videos like that would have
promoted both the ISPA and the event to other companies for the next years expo
but also would have given extra exposure to the companies themselves. It is
hard to explain a spa experience in just text and an image, video would have
been a great medium in which to show of everyone and everything at #ISPA 2013.
The greatest and most annoying thing about social media is how fast everything moves. With the velocity of news and social media today is to easy to get lost, especially when you are trying to figure out what to do on your own social media channels. I know there are a lot of strategies and systems out there for how to schedule content. I can't tell you the best method but I can share my quick method for planning posts and most importantly staying focused. Below is my quick system along with a month of planned posts as an example. I used the Disney Animal Kingdom as an example for which to schedule my posts, provide goals, and build out a month worth of posts.
Schedule Ahead of Time
It is incredibly hard to find and post something new day by day. Work, meetings, and nap time always interfere with posting at the right time. To side step this problem use on the of the many social media management tools available out there to schedule your posts. Here are three that I have tried and found very helpfull.
1. HootSuite - HootSUite is great, even the free version is awesome. If you are a small business the fee for the professional version is still very affordable.
2. SocialOomph - Another popular social management tool that provides a variety of helpful analytics and options for managing the most popular social media platforms.
3. Buffer - I love Buffer's look and clean design. Buffer also provides some analytical capabilities for your platforms as well as additional apps.
Have Goals
If you are just randomly posting you are most likely getting nowhere. After all you are on social media for a reason so make social media work for you. Set goals and sub-goals for each platform or your entire network. Make at least 50% of your posts directly support one of your goals or sub-goals.
Schedule Your Posts
This is an example of my schedule for Disney's Animal Kingdom. I created the entire calendar in Excel since I am a bit of an Excel geek. You can use a management tool to schedule all these posts. Even when I schedule all my posts on a tool like HooSuite I still keep track of my posts on a calendar like this. Each day will have either the post or subject of the post and whether is support any of the goals. This allows me to track whether I was on following my own goals and what topics and posts worked best. Over time this will build you a library of data that you can use to analyze and prove your success.
Create Your System
No system is perfect for every occasion. Borrow parts of mine or create your own. It is important to keep a consistent method for the way you work and post on social media in order to prove ROI, identify your KPI's, and provide metrics on everything you do. Constantly changing tools and methods will lead to confussion and issues in the long run. Download my example Excel sheet to take a deeper look at a months worth of posts. Feel free to use it, change it, copy it, or burn it, I just hope it helps in some way.
Social media is spreading like bunnies and consuming the
world. Just as the major platforms keep growing and engulfing every possible
internet user in the world there is a growing fatigue of the same old. Facebook
is not the best for professional networking, LinkedIn is completely diluted
with people in the different professions and jobseekers, and it is pretty hard
to carry on a long conversation on Twitter. The general focus of the many
social media platforms has spawned many smaller social platforms designed
specifically for special interests.
Active Rain is one of those niche platforms that focuses on
networking, needs, and interests of real estate agents. The real estate market
varies from area to area as do the laws governing the sales of real estate form
each state. However the fundamentals of a realtors job remain the same,
providing value to the home buyer and seller. Real estate agents assist you in what
is probably the biggest purchase and debt in your life, your house. As the work
is incredibly competitive and each agent works on commissions it can be
complicated for an agent to find help or advice. Active Rain attempts to fill
those gaps in knowledge by linking together real estate agents with each other
to share advice, write blogs, and answer each other’s questions.
Average name, Better Network
Whether you think Active Rain is great name for the social
networking site or not, the platform itself is pretty good. The website boasts
over 300,000 users who contribute within the platform, although it is a bit
hard to tell how many are active. Active Rain is the largest social media
platform aimed at connecting real estate agents. Although there are a number of
other networks, none of them had the number of members or aimed at simply
connecting real estate agents. There are a number of other networks that are
specifically aimed at connecting realtors and builders, or realtors and
lenders.
Blog Section on Active Rain
The platform functions a bit different than what a typical
social media platform. There are no huge scrolling feeds of cat pictures and
daily lunch updates. Instead the network is almost a huge collection of shorterblogs. Although this seems a bit strange at first it is an interesting option and
interesting departure from the typical.
Users post their “blog” entries either in groups or just to the community in
general. From there on users earn merit badges, comment on posts, answer to
comments on their posts, and follow each other’s posts just like a real blog.
The entries range from short posts about a daily gripe to long thesis about low
ball offers. There is also a question and answer section where anyone can pose
a questions and one of the members will answer.
Active Rain Group
There are a range of functions that are similar to
traditional media channels. Users can message and follow each other. There is a
great function where you can ask a question and direct it at any user for them
to publicly answer. The website also provides resource tab which lists
companies that an agent may use. These companies range from lead generation to
printing business cards. Just like everything else on the website users are
able to review the businesses and provide their comments on the services. Only
the businesses with the top ratings are retained under the resources tabs.
The platform does suffer from a few minor setbacks. The lack
of a traditional post feed is a bit strange. Although the feed of blog posts
takes its place it does not have the same visual appeal as it lacks the images
and videos typical to most social media. This may because I am so used to the
traditional social media look and there just has to be a minor adjustment
period. There are also some minor design issues. Although there are many fans
of the simple white backgrounds the layout of the page is not optimal, the
layout feels slightly convoluted. At first trying to find each feature on the
site can be a bit complicated. The question and answer section is not well
indexed or laid out, it can take some time to find the right questions and
answer.
Q&A Section
Proximity Marketing
There are numerous opportunities for proximity marketing in
real estate. It is surprising to see that some of the major real estate
websites have not created an app that allows agents to provide info on their
listed houses whenever a potential buyer comes to see it. I don’t know whether
it would be economical to add a blue tooth or WiFi emitter at each property but
a GPS enabled app would work perfect. Whenever a potential client would come
close to a property for sale they would be alerted through an app that there is
additional information. This could be a video, financial information, or
specific details about the property. Additionally the app would provide
information on how to contact the selling agent, information about the agent,
and provide similar listings. Actually I might be on to a million dollar idea.
The Integrated Approach to Marketing and Real Estate
Since there is no specific demographic or social network for
people who buy houses real estate agents can utilize almost anything alongside
Active Rain. The major social media platforms such as Facebook and Twitter are
a given for reaching a wide audience and building a brand. Traditional mail
outs, print advertising, and Google AdWords. The insights and advice gained
from other agents can be applied to all of the mentioned forms of advertising.
An agent could send out letters with buying tips, buy AdWords based on others
advice, or use the tips to better describe their homes on Zillow and Trulia.
Are you new to Facebook? Do you need to quickly figure out
how Facebook Page Insights work to vow your boss? Need to be able to speak the
Facebook lingo by tomorrow? Whatever the reason, you are at the right place. We
are going to quickly look at what Facebook is, where it came from, and how to
utilize the in depth analytics suite that Facebook offers to individuals and
businesses. This post is also available in Prezi version. The Prezi has narration and is best enjoyed with the sound on.
A Bit About the
History of Facebook
Facebook is currently the largest social network in the
world today with over a billon registered users. That means if every user is
unique then 1 out of every 7 people on this planet is on Facebook. The social media
giant is available in almost every country and connects more people than ever. Facebook
is actually one of the main reasons that the degree of separation between
anyone on the planet has shrunk
from about 6 to 4.74.
If you have seen the movie “The Social Network” you can
generally skip over this part, or read it, up to you. Facebook originally wasn’tthe Facebook that it is today, nor was it designed to be a global tool forconnecting with friends and playing Candy Crush. Facebook had much more humble
origins in the prestigious Harvard University. On Januray 11th, 2004
Mark Zuckerberg (CEO of Facebook) registered the facebook.com domain. In an
interview with the Harvard Crimson Zuckerberg mentioned that he was inspired to
create the website based on another failed venfture he had attempted prior. At
the very beginning Facebook was only available to students at Harvard
University. The day after the launch of Facebook some 1200-1500 users were
already registered.
As we all know Facebook did not stay contained to the
pristine halls of Harvard but spread across the world. As word of mouth spread,
Facebook was rolled out across universities across America and then finally was
opened for anyone to join. From there it has been a meteoric rise to the Nr.1
social media platform in the world. Since then Facebook acquired several other
prominent social media platforms such as FriendFeed, Instagram, and then
finally in 2012 went public with a much hyped IPO.
How does Facebook
work?
Anyone can sign up and create a profile on Facebook to
connect with friends, groups, or businesses. Once you have your account all set
up you can request to be friends with other people. Once they approve your ‘Friend
Request” you can message each other. You will also receive your friends updates
and posts in your “news feed” as they post through the day. You can also share
your own updates about your life, post links from the internet, create and
share photo albums, as well as include as much, or little, information about
yourself as you wish in your profile.
Facebook is filled with other nifty features. There are
thousands of apps that you can utilize to enhance your Facebook experience. The
apps can range anything from games like Candy Crush, organizational apps, apps
that tie in other networks like Twitter, and apps that remind you of your friend’s
birthdays on Facebook. It has to be noted that each app request some personal
information as well as some access to your profile. Some apps will even post
updates upon your behalf. There are also groups and business pages that you can
follow for their information or special social media deals. Groups and Business
Pages act differently than regular user profiles but more about that later.
Facebook Page
Insights a.k.a Analytics
Apart from the traditional user profile individuals and
companies can create two additional types of profiles, Group and Business Page.
There are multiple differences between Business, Group, and Personal pages.
What is important about the Business page is their ability to access Facebook
Page Insights, which provide an in depth view of how your group or page is
doing, which posts are most popular, and how can they be improved.
Facebook recently rolled out the latest iteration of Page
Insights. Apart from changing the look of Insights several features were
deprecated, while others were added. From a personal standpoint I find the new
version an improvement. However the new look is throwing some people for a loop
and if you are new to social media analytics or Page Insights the new version
looks a bit more daunting than before. Have no fear though, we will walk
through each tab and a bit of the Insights export.
The main tabs of Page Insights overall function on a few set
metrics that it displays in relation to other variables. Once you have the
basic grasp of these terms and how they work Insights is a breeze to read. For each tab on the Insights panel I defined a few key terms which are in bold and underlined. There is also a PDF attachment that you can download with the main terms and
meanings for future reference. So, let's jump in.
Page Insights Access and
Admin Panel
REACH –
The number of people who saw your post. This means that your post made it to
the users news feed. This includes both mobile devise as well as desktop. There
is no guarantee that the user read the post, only that they were exposed to it.
Once you are looking at your business page the
Administrators panel and Page Insights button is displayed. The overview in the
Admin panel shows you the latest posts as well as how many people the post
reached, how many people have seen your posts this week, and the change from
last week. To access Page Insights click on the “See All” button in the
Insights box of
Page Insights
Overview Tab
UNIQUE USER
– Facebook generates a large number of metrics. For many of the metrics
Facebook will define something as the number of unique user interactions or
clicks, or whatever else. This means that no matter how many times a user interacted
with a post, they are only one interaction. For example for Reach a user can see
your post multiple times but the Reach metric counts the number of different
(unique) users that saw it, not the total of times the post was seen.
ENGAGEMENT –
The number of unique people who in some way interacted with your post. This can
be a click on the post link, a click on the actual post, a share, or a comment.
POST CLICKS –
The number of people who clicked on your post NOT including likes, comments, or shares. This can be a click on
the link, click to expand the post, or any other click. Page Insights Exports
even tracks if someone hovered their mouse over your post.
The overview view tab gives you general info about the
performance of your pages over the last 7 days. The date range is non-adjustable,
at least for now. Clicking on any of the displayed charts or data will jump you
to one of the other tabs for a more in depth look at the data. The charts on
the overview tab compares the last 7 days to the 7 previous days. Each chart
also compares Likes, Reach, and Engagement with a separate line to illustrate
how the page has been doing.
Page Likes – Page
Likes is a simple metric. It simply compares the rise, or fall, in the number
of users the have “Liked” your page.
Post Reach – Summarizes
how many people were reached over the last week and compares it to the prior
week.
Engagement – Outlines
the engagement with your page over the last week and compares it to the prior
week.
5 Most Recent Posts –
Here you can see the last 5 posts and how they did. Each post is identified
what type (Text, image, link, video, poll), whether it was public, how many
people it reached and how people interacted with it.
Page Insights Likes
Tab
ORGANIC LIKES
– The number of likes gained from posts or the page that were not advertised or
seen as a part of an advertisement.
PAID LIKES
– The number of likes that the page gained from advertising the page or a
specific post.
PAGE SUGGESTIONS
– User liked your page because Facebook suggested your page based on the users
other preferences.
This is a very straightforward page that shows you where
your likes, or unlikes, came from. On this page you can adjust the date range
to compare different epochs. Here you can see whether most users choose to like
your page from your posts, your page, or suggestions made by Facebook.
The first two graphs show the increase of likes for your
page over time and the current number of likes that you have now. There is no
additional data from the first graph. The second graph shows the number of new
likes and Unlikes and breaks them down whether they were organic or paid. The
data range is editable from the selection at the top of the page. You can click
within the graph to receive more detailed information about the specific day
that you are looking at to see the breakdown of news Likes and Unlikes. Are you seeing a dip in Likes or rise in Unlikes?
This could indicate issues with your pages post, whether it is posting too
much, too little, or posting content that is not resonating with your audience.
Total number of Likes
Net Likes
The final graph on the Likes Tab shows where your likes came
from. There are 5 overall possible sources of Likes.
On Your Page – The total number of people who visited your page and clicked Like.
Page Suggestions –
Facebook suggested your page to a user and they clicked Like.
Mobile – A user
was on a mobile device such as a pad or a phone and Liked your page. You don’t
know whether this was because of a post or on your page. Laptops are considered
mobile.
Your Posts –
Someone saw your post and clicked Like.
NEGATIVE ACTIONS
– It is hard for Facebook to determine whether any individual likes or dislikes
a post. On multiple metrics in the Insights exports Facebook mentions negative
actions. Negative actions are when a user unfriends your page (NNNOOOO!!!),
hides the post, or reports it as spam.
The reach tab brakes down the different ways the your page
and posts reached Facebook users. Each of the four graphs breaks down the Reachmetric into different components for better analysis. On each chart you can
select which metric or “Benchmark” you wish to view. You can select one of them
at a time or view all together. The time range is adjustable at the top of the page.
Post Reach – The
Post Reach chart display all the unique Facebook users who saw your page or
posts. The numbers are divided into organic and paid.
Likes, Comments, and
Shares - As the title suggests this graph breaks down the number of likes,
comments, and shares that your posts received. View them all together or one at
a time.
Hide, Report as Spam,
and Unlikes – This graph displays what Facebook terms “negative actions”
against your page and posts. You can see here which posts were most unpopular
and what users did about it. If a specific type of posts consistently receives negative
feedback you may want to reconsider your content strategy.
Total Reach – This
is your total unique user reach. Separate from Post Reach, Total Reach also
takes into account the views after someone shared or liked you, or paid ads.
Page Insights Visits
Tab
The Visits tab displays how Facebook users interacted with
your page and how they got there. You can see exactly what users looked at on
your page, whether they left comments, used any of your offered deals, and
where they came from if they visited your page from outside of Facebook.
Page and Tab Visits –
The graph illustrates what users clicked on while on your page. You can see
how many times looked at your Likes, Photos, Timeline, or anything else. You
can click into the graph and see more any specifics for each day or day range.
Other Page Activity –
Here you can see whether someone interacted with your page. This could be a
check-in if you have a location, any offers purchased, mentions of you on their
posts, or any posts by others if you allow them.
External Referrers – This
is an incredibly important graph. Here you can see if anyone visited your page
from outside of Facebook. You can notice if anyone else is linking to your
page, how much traffic your website is driving to the page, and if there are
any unexpected sources of traffic.
Page Insights Posts Tab
This tab holds one of the major additions to Page Insights,
as well as a major time saver. The first two graphs on this tab show during
which days and what times fans of your page are active. No longer do you have
to create charts and normalize data from Insights Exports to figure this out.
Although there are always best suggested times to post this tab will no
accurately tell you what is the best time to post.
Day – The day
chart displays the activity of your fans by day. If you scroll over the bars it
will show you the times that users are most active on that day. Using that you
can schedule your posts for maximum reach.
Time – These are the local time during which your fans are most active. The times are based on your computers time zone which is important to keep in mind if you operate across multiple time zones. The display in this graph is average across all days of the week.
All Published Posts –
This displays all the information about your post just like in the overview
tab. Unlike in the Overview tab you can see all the posts you have ever posted.
This will also display all the engagement with your posts.
Unlike some of the other tabs, the Posts tab has two
sub-tabs. At the top of the page you can switch between When Your Fans Are
Online sub-tab and Post Type sub-tab. In the Post Type sub-tab each type of
posts success will be summarized. You will be able to see the average reach and
average engagement for every post type that may have ever used.
Page Insights People
Tab
Just like the Posts tab the People tab has several sub –tabs.
The metrics and graphs displayed under each sub-tab are the same, just the
parameters change. The People tab is an overview of the demographics and
locations of the individuals that you have reached.
Demographic breakdown
– The demographics are separated by male and female and into age brackets.
Facebook draws this information from the users profile and only is as accurate
as the user profile itself, however is very close to reality since few people
incorrectly represent their gender or age. You can scroll over each bar for
additional information.
Location breakdown – If
you are a local or national business you can see the people you are engaging.
Here you can understand whether you need to focus your content or widen it so
it appeals to more people. You will also be able to see the langue of the users
which accessed your profile.
Page Insights Export
If you think the 6 tabs contain a lot of information prepare
to have your mind blown. By clicking the export data tab at the top right of
the page you can export both Post level data and Page level data. You can
select the date range for which you want the data as well as the format. I
suggest you export into the Excel format as the CSV combines all the
information into a single Excel sheet which ends up having over a thousand
different columns making it very tedious to read. The explanation of all the
metrics included in the export are beyond any blog post. If you would like to
know more or have any questions about the exports please don’t hesitate to
contact me.
The page level data includes all the imaginable data for
your entire page. This includes number of likes, engagement in every imaginable
format, locations of visit, virality, and literally hundreds of other metrics.
These become a lot more valuable if you are running paid campaigns. All data is
separated by day, week, and 28 day period for each metric.
The post level data contains all data related to each post
you have made. This includes interaction (positive or negative), sources of
likes, times, and yet again hundreds of other metrics. Many of the metrics are
again separated into epochs.